

[May-2026] NSE7_SOC_AR-7.6 Certification with Actual Questions from Prep4pass
Updated NSE7_SOC_AR-7.6 Dumps PDF - NSE7_SOC_AR-7.6 Real Valid Brain Dumps With 59 Questions!
Fortinet NSE7_SOC_AR-7.6 Exam Syllabus Topics:
| Topic | Details |
|---|---|
| Topic 1 |
|
| Topic 2 |
|
| Topic 3 |
|
| Topic 4 |
|
NEW QUESTION # 22
Refer to Exhibit:
You are tasked with reviewing a new FortiAnalyzer deployment in a network with multiple registered logging devices. There is only one FortiAnalyzer in the topology.
Which potential problem do you observe?
- A. The analytics-to-archive ratio is misconfigured.
- B. The archive retention period is too long.
- C. The analytics retention period is too long.
- D. The disk space allocated is insufficient.
Answer: A
Explanation:
* Understanding FortiAnalyzer Data Policy and Disk Utilization:
* FortiAnalyzer uses data policies to manage log storage, retention, and disk utilization.
* The Data Policy section indicates how long logs are kept for analytics and archive purposes.
* The Disk Utilization section specifies the allocated disk space and the proportions used for analytics and archive, as well as when alerts should be triggered based on disk usage.
* Analyzing the Provided Exhibit:
* Keep Logs for Analytics:60 Days
* Keep Logs for Archive:120 Days
* Disk Allocation:300 GB (with a maximum of 441 GB available)
* Analytics: Archive Ratio:30% : 70%
* Alert and Delete When Usage Reaches:90%
* Potential Problems Identification:
* Disk Space Allocation:The allocated disk space is 300 GB out of a possible 441 GB, which might not be insufficient if the log volume is high, but it is not the primary concern based on the given data.
* Analytics-to-Archive Ratio:The ratio of 30% for analytics and 70% for archive is unconventional.
Typically, a higher percentage is allocated for analytics since real-time or recent data analysis is often prioritized. A common configuration might be a 70% analytics and 30% archive ratio. The misconfigured ratio can lead to insufficient space for analytics, causing issues with real-time monitoring and analysis.
* Retention Periods:While the retention periods could be seen as lengthy, they are not necessarily indicative of a problem without knowing the specific log volume and compliance requirements.
The length of these periods can vary based on organizational needs and legal requirements.
* Conclusion:
* Based on the analysis, the primary issue observed is theanalytics-to-archive ratiobeing misconfigured. This misconfiguration can significantly impact the effectiveness of the FortiAnalyzer in real-time log analysis, potentially leading to delayed threat detection and response.
References:
Fortinet Documentation on FortiAnalyzer Data Policies and Disk Management.
Best Practices for FortiAnalyzer Log Management and Disk Utilization.
NEW QUESTION # 23
Refer to the exhibit.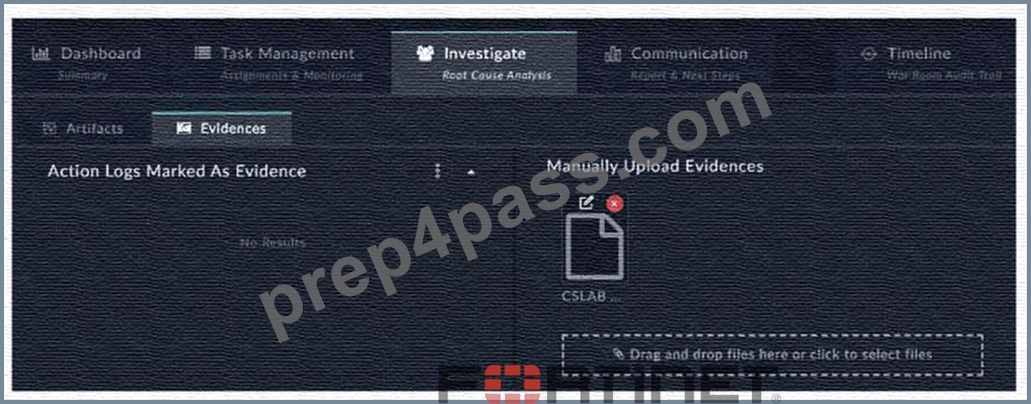
How do you add a piece of evidence to the Action Logs Marked As Evidence area? (Choose one answer)
- A. By executing a playbook with the Save Execution Logs option enabled
- B. By tagging output or a workspace comment with the keyword Evidence
- C. By linking an indicator to the war room
- D. By creating an evidence collection task and attaching a file
Answer: B
Explanation:
Comprehensive and Detailed Explanation From FortiSOAR 7.6., FortiSIEM 7.3 Exact Extract study guide:
InFortiSOAR 7.6, theWar Roomis a collaborative space designed for high-priority incident investigation.
TheEvidencestab within theInvestigateview (as shown in the exhibit) is specifically designed to highlight critical findings found during the investigation process.
* Evidence Tagging:To populate theAction Logs Marked As Evidencesection, an analyst must specifically tag a relevant log entry, a playbook output, or a comment within the collaboration workspace with the system-defined keyword"Evidence".
* Automatic Categorization:Once the tag is applied, FortiSOAR automatically parses these entries and displays them in this centralized view. This allows team members and stakeholders to quickly view substantiated facts and proof gathered during the "Root Cause Analysis" phase without sifting through all raw action logs.
* Manual vs. Action Logs:The exhibit shows two distinct areas: "Manually Upload Evidences" (where files like the CSLAB document shown can be dragged and dropped) and "Action Logs Marked As Evidence." The latter is reserved exclusively for system-generated logs or comments that have been promoted to evidence status via tagging.
Why other options are incorrect:
* By linking an indicator to the war room (B):Linking indicators associates technical artifacts (like IPs or hashes) with the record, but it does not automatically classify them as evidence within the War Room action log view.
* By creating an evidence collection task and attaching a file (C):While this is a valid step in an investigation, attaching a file to a task typically places it in the "Attachments" or "Manually Upload Evidences" area, rather than the "Action Logs" section specifically.
* By executing a playbook with the Save Execution Logs option enabled (D):Saving execution logs ensures a trail of what the playbook did, but it does not mark the output as "Evidence" unless the specific logic or a manual analyst action applies the "Evidence" tag to the resulting log entry.
NEW QUESTION # 24
Refer to the exhibits.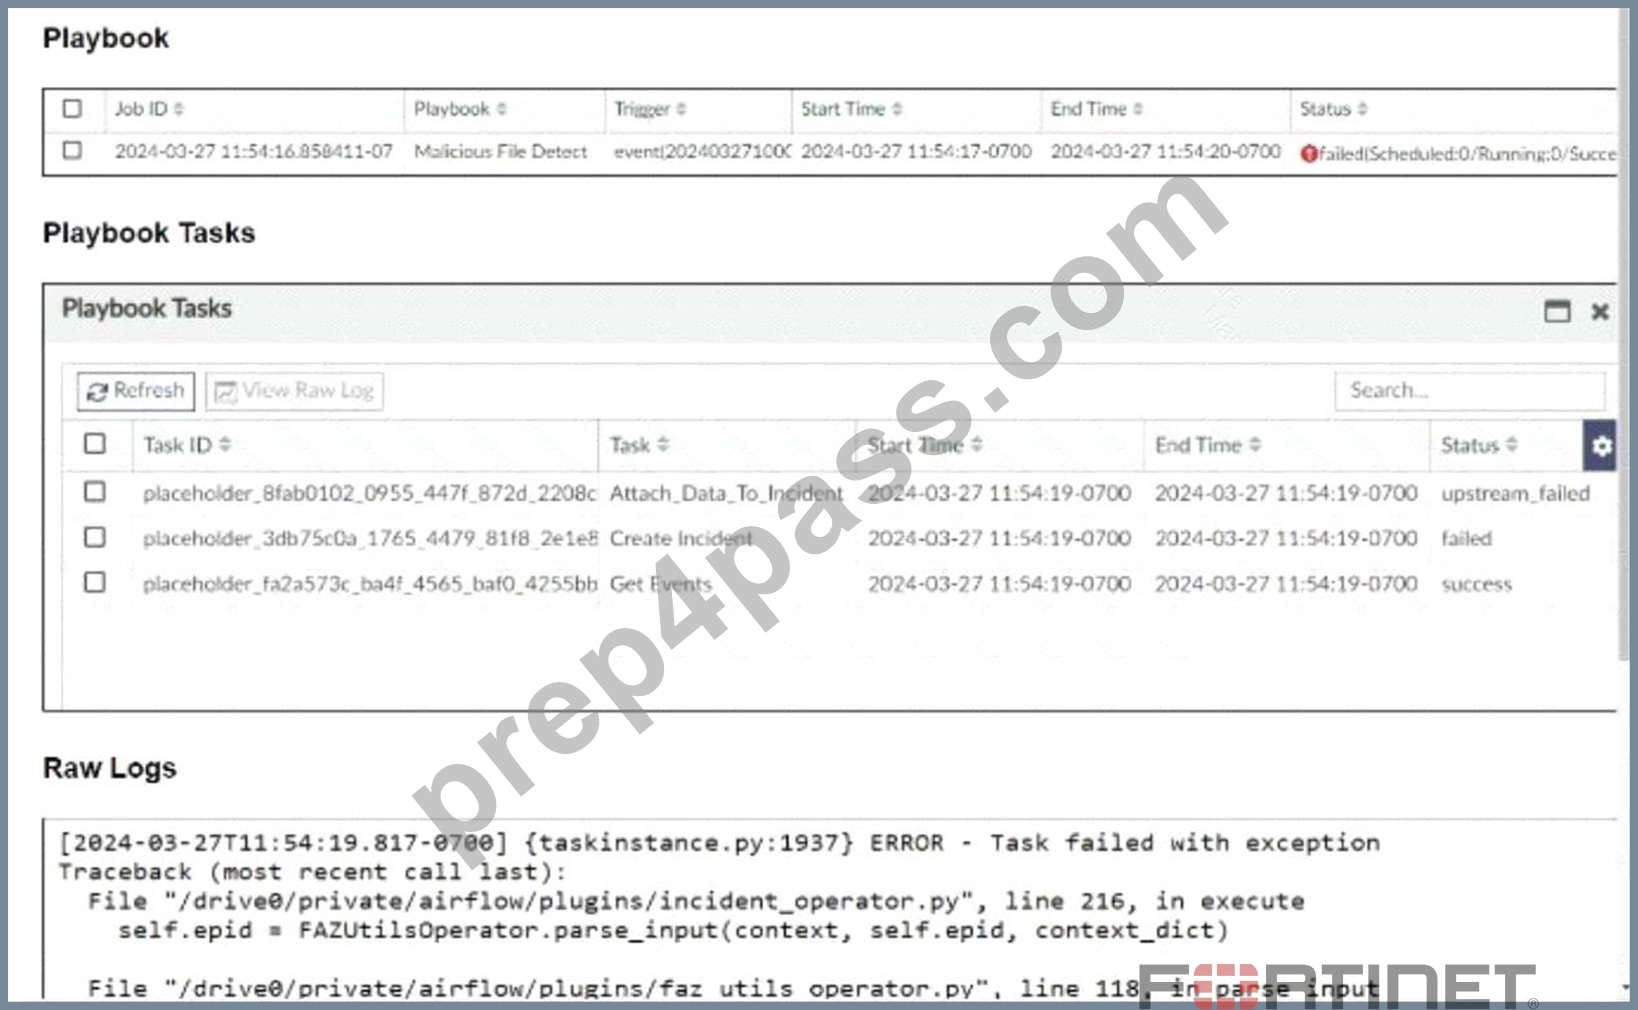
The Malicious File Detect playbook is configured to create an incident when an event handler generates a malicious file detection event.
Why did the Malicious File Detect playbook execution fail?
- A. The Create Incident task was expecting a name or number as input, but received an incorrect data format
- B. The Attach_Data_To_lncident incident task wasexpecting an integer, but received an incorrect data format.
- C. The Attach Data To Incident task failed, which stopped the playbook execution.
- D. The Get Events task did not retrieve any event data.
Answer: A
Explanation:
* Understanding the Playbook Configuration:
* The "Malicious File Detect" playbook is designed to create an incident when a malicious file detection event is triggered.
* The playbook includes tasks such as Attach_Data_To_Incident, Create Incident, and Get Events.
* Analyzing the Playbook Execution:
* The exhibit shows that the Create Incident task has failed, and the Attach_Data_To_Incident task has also failed.
* The Get Events task succeeded, indicating that it was able to retrieve event data.
* Reviewing Raw Logs:
* The raw logs indicate an error related to parsing input in the incident_operator.py file.
* The error traceback suggests that the task was expecting a specific input format (likely a name or number) but received an incorrect data format.
* Identifying the Source of the Failure:
* The Create Incident task failure is the root cause since it did not proceed correctly due to incorrect input format.
* The Attach_Data_To_Incident task subsequently failed because it depends on the successful creation of an incident.
* Conclusion:
* The primary reason for the playbook execution failure is that the Create Incident task received an incorrect data format, which was not a name or number as expected.
References:
Fortinet Documentation on Playbook and Task Configuration.
Error handling and debugging practices in playbook execution.
NEW QUESTION # 25
Refer to the exhibit.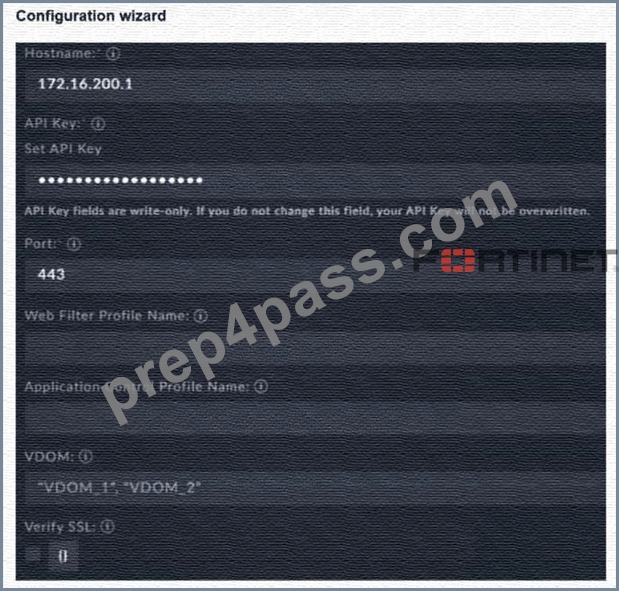
You must configure the FortiGate connector to allow FortiSOAR to perform actions on a firewall. However, the connection fails. Which two configurations are required? (Choose two answers)
- A. The VDOM name must be specified, or set to VDOM_1, if VDOMs are not enabled on FortiGate.
- B. An API administrator must be created on FortiGate with the appropriate profile, along with a generated API key to configure on the connector.
- C. Trusted hosts must be enabled and the FortiSOAR IP address must be permitted.
- D. HTTPS must be enabled on the FortiGate interface that FortiSOAR will communicate with.
Answer: B,D
Explanation:
Comprehensive and Detailed Explanation From FortiSOAR 7.6., FortiSIEM 7.3 Exact Extract study guide:
To establish a successful integration betweenFortiSOAR 7.6and aFortiGatefirewall via the FortiGate connector, specific administrative and network requirements must be met on the FortiGate side:
* API Administrator and Key (D):FortiSOAR does not use standard UI login credentials. Instead, it requires aREST API Administratoraccount to be created on the FortiGate. This account must be assigned an administrative profile with the necessary permissions (e.g., Read/Write for Firewall policies or Address objects). Upon creation, the FortiGate generates a uniqueAPI Key, which must be entered into the "API Key" field of the FortiSOAR configuration wizard as shown in the exhibit.
* HTTPS Management Access (C):The connector communicates with the FortiGate using REST API calls overHTTPS(port 443 by default). Therefore, the physical or logical interface on the FortiGate that corresponds to the "Hostname" IP (172.16.200.1) must haveHTTPSenabled under "Administrative Access" in its network settings. If HTTPS is disabled, the connection will time out or be refused.
Why other options are incorrect:
* Trusted hosts (A):While it is a best practice to restrict API access to specific IPs (like the FortiSOAR IP), the integration can technically function without "Trusted hosts" enabled if the network allows the traffic. However, theabsenceof an API key or HTTPS access will definitively cause a failure regardless of trusted host settings.
* VDOM name (B):In the exhibit, the VDOM field contains multiple values ("VDOM_1", "VDOM_2").
If VDOMs are disabled on the FortiGate, this field should generally be left blank or set to the default
"root." Setting it specifically to "VDOM_1" when VDOMs are disabled is not a universal requirement for connectivity; the primary handshake depends on the API key and HTTPS connectivity.
NEW QUESTION # 26
Which three statements accurately describe step utilities in a playbook step? (Choose three answers)
- A. The Loop step utility can only be used once in each playbook step.
- B. The Variables step utility stores the output of the step directly in the step itself.
- C. The Mock Output step utility uses HTML format to simulate real outputs.
- D. The Timeout step utility sets a maximum execution time for the step and terminates playbook execution if exceeded.
- E. The Condition step utility behavior changes depending on if a loop exists for that step.
Answer: A,D,E
Explanation:
Comprehensive and Detailed Explanation From FortiSOAR 7.6., FortiSIEM 7.3 Exact Extract study guide:
InFortiSOAR 7.6, step utilities are advanced configurations applied to individual playbook steps to control logic, timing, and data processing. According to the Playbook Engine architecture:
* Timeout (A):TheTimeoututility allows an administrator to define a maximum duration for a step to complete. If the step does not finish within this designated window, the playbook engine terminates the step and the overall playbook execution to prevent hung processes and resource exhaustion.
* Loop (B):TheLooputility is used for iterative processing (e.g., performing a lookup for every IP in a list). A playbook step can only containone Loop utility configuration. If multiple iterations are required across different data sets, they must be handled in separate steps or nested child playbooks.
* Condition (D):TheConditionutility (Decision Step logic) behaves differently when aLoopis present. If there is no loop, the condition determines if the step executes once. If a loop is present, the condition is evaluated foreach itemin the loop, effectively acting as a filter for which iterations proceed.
Why other options are incorrect:
* Variables (C):TheVariablesutility (Set Variable) is used to define new custom variables within the scope of that step for later use. It does not "store the output of the step directly in the step itself"; step outputs are automatically stored in the vars.steps.<step_name> object by the engine regardless of the utility used.
* Mock Output (E):TheMock Outpututility is used for testing and development to simulate successful data returns without actually executing a connector. It usesJSON format, not HTML, to ensure the simulated data structure matches what the playbook engine expects for downstream Jinja processing.
NEW QUESTION # 27
Refer to the exhibits.
The DOS attack playbook is configured to create an incident when an event handler generates a denial-of-ser
/ice (DoS) attack event.
Why did the DOS attack playbook fail to execute?
- A. The Get Events task is configured to execute in the incorrect order.
- B. The Attach_Data_To_lncident task failed.
- C. The Attach_Data_To_lncident task is expecting an integer value but is receiving the incorrect data type.
- D. The Create SMTP Enumeration incident task is expecting an integer value but is receiving the incorrect data type
Answer: D
Explanation:
* Understanding the Playbook and its Components:
* The exhibit shows the status of a playbook named "DOS attack" and its associated tasks.
* The playbook is designed to execute a series of tasks upon detecting a DoS attack event.
* Analysis of Playbook Tasks:
* Attach_Data_To_Incident:Task ID placeholder_8fab0102, status is "upstream_failed," meaning it did not execute properly due to a previous task's failure.
* Get Events:Task ID placeholder_fa2a573c, status is "success."
* Create SMTP Enumeration incident:Task ID placeholder_3db75c0a, status is "failed."
* Reviewing Raw Logs:
* The error log shows a ValueError: invalid literal for int() with base 10: '10.200.200.100'.
* This error indicates that the task attempted to convert a string (the IP address '10.200.200.100') to an integer, which is not possible.
* Identifying the Source of the Error:
* The error occurs in the file "incident_operator.py," specifically in the execute method.
* This suggests that the task "Create SMTP Enumeration incident" is the one causing the issue because it failed to process the data type correctly.
* Conclusion:
* The failure of the playbook is due to the "Create SMTP Enumeration incident" task receiving a string value (an IP address) when it expects an integer value. This mismatch in data types leads to the error.
References:
Fortinet Documentation on Playbook and Task Configuration.
Python error handling documentation for understanding ValueError.
NEW QUESTION # 28
Which FortiAnalyzer feature uses the SIEM database for advance log analytics and monitoring?
- A. Outbreak alerts
- B. Asset Identity Center
- C. Event monitor
- D. Threat hunting
Answer: D
Explanation:
* Understanding FortiAnalyzer Features:
* FortiAnalyzer includes several features for log analytics, monitoring, and incident response.
* The SIEM (Security Information and Event Management) database is used to store and analyze log data, providing advanced analytics and insights.
* Evaluating the Options:
* Option A: Threat hunting
* Threat hunting involves proactively searching through log data to detect and isolate threats that may not be captured by automated tools.
* This feature leverages the SIEM database to perform advanced log analytics, correlate events, and identify potential security incidents.
* Option B: Asset Identity Center
* This feature focuses on asset and identity management rather than advanced log analytics.
* Option C: Event monitor
* While the event monitor provides real-time monitoring and alerting based on logs, it does not specifically utilize advanced log analytics in the way the SIEM database does for threat hunting.
* Option D: Outbreak alerts
* Outbreak alerts provide notifications about widespread security incidents but are not directly related to advanced log analytics using the SIEM database.
* Conclusion:
* The feature that uses the SIEM database for advanced log analytics and monitoring in FortiAnalyzer isThreat hunting.
References:
Fortinet Documentation on FortiAnalyzer Features and SIEM Capabilities.
Security Best Practices and Use Cases for Threat Hunting.
NEW QUESTION # 29
Refer to the exhibits.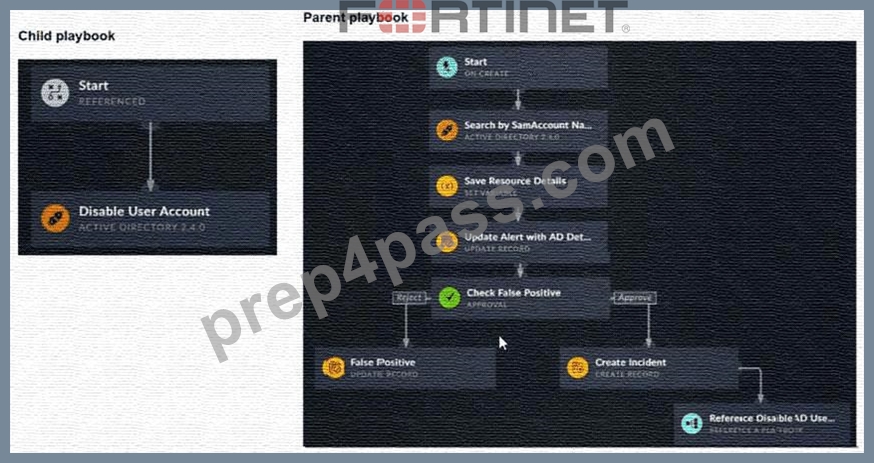
You have a playbook that, depending on whether an analyst deems the alert to be a true positive, could reference a child playbook. You need to pass variables from the parent playbook to the child playbook.
Place the steps needed to accomplish this in the correct order.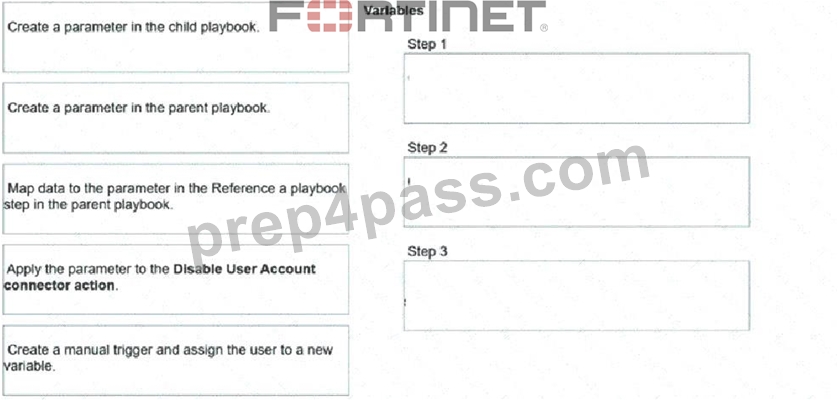
Answer:
Explanation: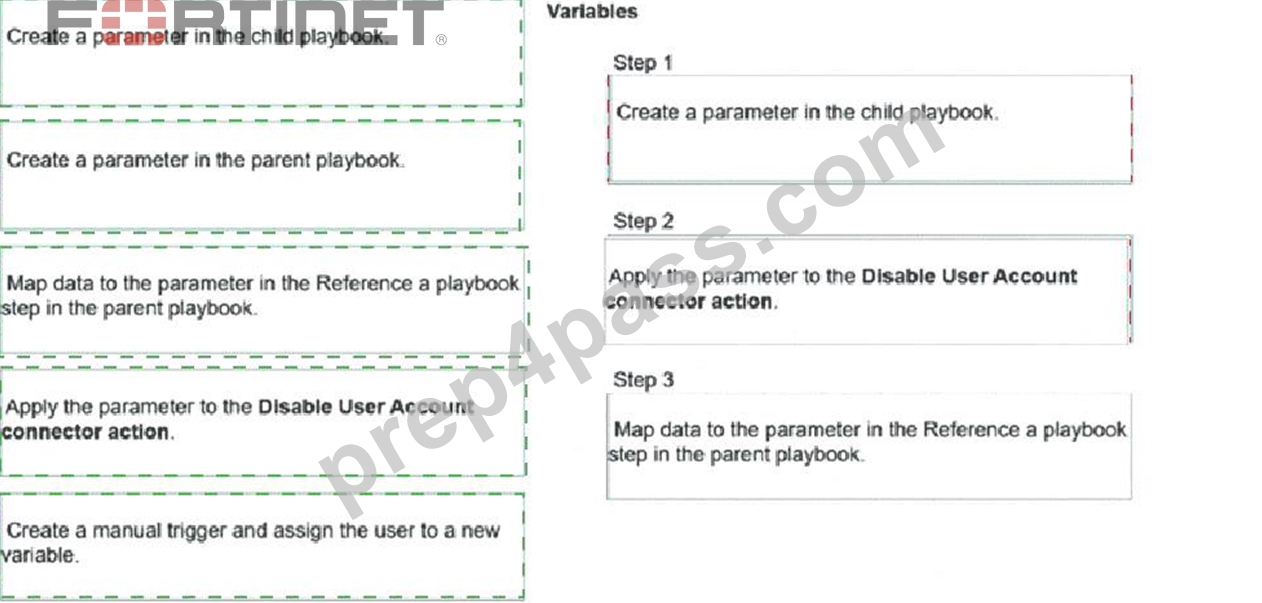
Explanation:
1. Create a parameter in the child playbook.
2. Apply the parameter to the Disable User Account connector action.
3. Map data to the parameter in the Reference a playbook step in the parent playbook.
Comprehensive and Detailed Explanation From FortiSOAR 7.6., FortiSIEM 7.3 Exact Extract study guide:
InFortiSOAR 7.6, the methodology for passing data between playbooks-specifically from a parent to a
"Referenced" (child) playbook-follows a strict data flow hierarchy:
* Step 1: Create a parameter in the child playbook.Before a parent can send data, the child playbook must be configured to receive it. This is done by adding "Input Parameters" in theStartstep of the child playbook (configured as a "Referenced" trigger). These parameters act as the "inbox" for external data.
* Step 2: Apply the parameter to the connector action.Once the child playbook has the parameter defined (e.g., user_id), you must use a Jinja expression like {{vars.input.params.user_id}} within the child's action steps (such as theActive Directory: Disable User Accountconnector) so that the child playbook actually utilizes the data it receives.
* Step 3: Map data to the parameter in the parent playbook.Finally, in the parent playbook, when you add theReference a Playbookstep and select the child playbook, FortiSOAR automatically displays the parameters created in Step 1. You then map existing variables from the parent's environment (e.g., from a previous "Search by SamAccountName" step) into these fields to complete the hand-off.
Why other options are excluded:
* Create a manual trigger and assign the user to a new variable:While manual triggers capture data, they are not the mechanism forpassingdata between nested playbooks; they are for user-to-system interaction.
* Create a parameter in the parent playbook:Parameters in a parent playbook are used to receive data fromoutside(like an external API or manual input), not to send datadownto a child. The child defines what it needs; the parent simply provides it in the Reference step.
NEW QUESTION # 30
Refer to the exhibit.
Assume that all devices in the FortiAnalyzer Fabric are shown in the image.
Which two statements about the FortiAnalyzer Fabric deployment are true? (Choose two.)
- A. FAZ-SiteA has two ADOMs enabled.
- B. FortiGate-B1 and FortiGate-B2 are in a Security Fabric.
- C. There is no collector in the topology.
- D. All FortiGate devices are directly registered to the supervisor.
Answer: A,B
Explanation:
* Understanding the FortiAnalyzer Fabric:
* The FortiAnalyzer Fabric provides centralized log collection, analysis, and reporting for connected FortiGate devices.
* Devices in a FortiAnalyzer Fabric can be organized into different Administrative Domains (ADOMs) to separate logs and management.
* Analyzing the Exhibit:
* FAZ-SiteAandFAZ-SiteBare FortiAnalyzer devices in the fabric.
* FortiGate-B1andFortiGate-B2are shown under theSite-B-Fabric, indicating they are part of the same Security Fabric.
* FAZ-SiteAhas multiple entries under it:SiteAandMSSP-Local, suggesting multiple ADOMs are enabled.
* Evaluating the Options:
* Option A:FortiGate-B1 and FortiGate-B2 are underSite-B-Fabric, indicating they are indeed part of the same Security Fabric.
* Option B:The presence of FAZ-SiteA and FAZ-SiteB as FortiAnalyzers does not preclude the existence of collectors. However, there is no explicit mention of a separate collector role in the exhibit.
* Option C:Not all FortiGate devices are directly registered to the supervisor. The exhibit shows hierarchical organization under different sites and ADOMs.
* Option D:The multiple entries underFAZ-SiteA(SiteA and MSSP-Local) indicate that FAZ-SiteA has two ADOMs enabled.
* Conclusion:
* FortiGate-B1 and FortiGate-B2 are in a Security Fabric.
* FAZ-SiteA has two ADOMs enabled.
References:
Fortinet Documentation on FortiAnalyzer Fabric Topology and ADOM Configuration.
Best Practices for Security Fabric Deployment with FortiAnalyzer.
NEW QUESTION # 31
Refer to the exhibit.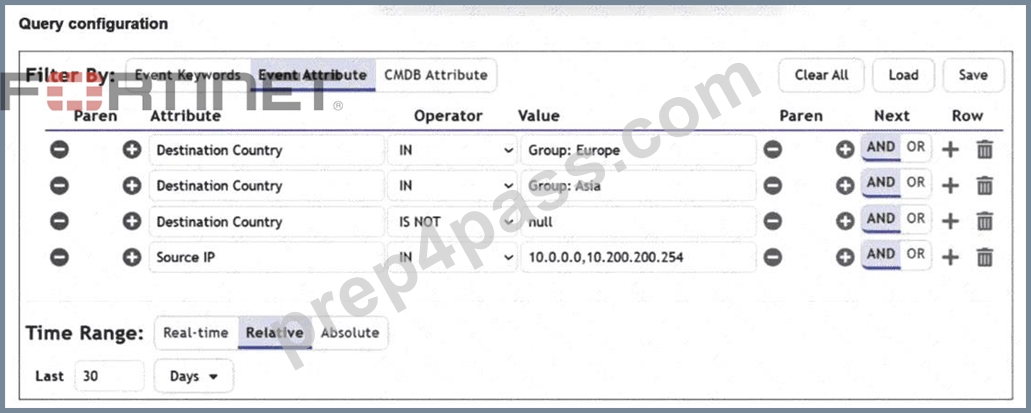
You are trying to find traffic flows to destinations that are in Europe or Asia, for hosts in the local LAN segment. However, the query returns no results. Assume these logs exist on FortiSIEM.
Which three mistakes can you see in the query shown in the exhibit? (Choose three answers)
- A. There are missing parentheses between the first row (Group: Europe) and the second row (Group: Asia).
- B. The time range must be Absolute for queries that use configuration management database (CMDB) groups.
- C. The logical operator for the first row (Group: Europe) must be OR.
- D. The Source IP row operator must be BETWEEN 10.0.0.0, 10.200.200.254.
- E. The null value cannot be used with the IS NOT operator.
Answer: A,C,D
Explanation:
Comprehensive and Detailed Explanation From FortiSOAR 7.6., FortiSIEM 7.3 Exact Extract study guide:
Analyzing theQuery Configurationexhibit in the context of FortiSIEM 7.3 search logic reveals several syntax and logical errors that prevent the query from returning results:
* Logical Operator Error (E):The user intends to find traffic to EuropeORAsia. In the exhibit, the first row (Group: Europe) is followed by a defaultANDoperator. This forces the query to look for a single flow where the destination is simultaneously in Europe and Asia, which is logically impossible. It must be changed toOR.
* Missing Parentheses (C):When combiningORandANDlogic in FortiSIEM, parentheses are required to define the order of operations. Without them, the query might evaluate "Asia AND Destination Country IS NOT null AND Source IP IN..." first. To correctly find (Europe OR Asia) that also matches the LAN segment, parentheses must group the first two rows.
* Incorrect Operator for IP Range (D):The exhibit uses theINoperator for the value 10.0.0.0,
10.200.200.254. In FortiSIEM, theINoperator is used for a comma-separated list of specific values or CMDB groups. To specify a continuous range of IP addresses (the "LAN segment"), theBETWEENoperator must be used.
Why other options are incorrect:
* IS NOT null (A):In FortiSIEM, "IS NOT null" is a valid operator/value combination used to ensure a specific attribute has been successfully parsed and populated in the event record.
* Time Range (B):There is no requirement for a time range to be "Absolute" when using CMDB groups;
"Relative" time ranges (like the "Last 30 Days" shown) are commonly used and fully supported for such queries.
SOC Concepts and Frameworks
NEW QUESTION # 32
Refer to the exhibit.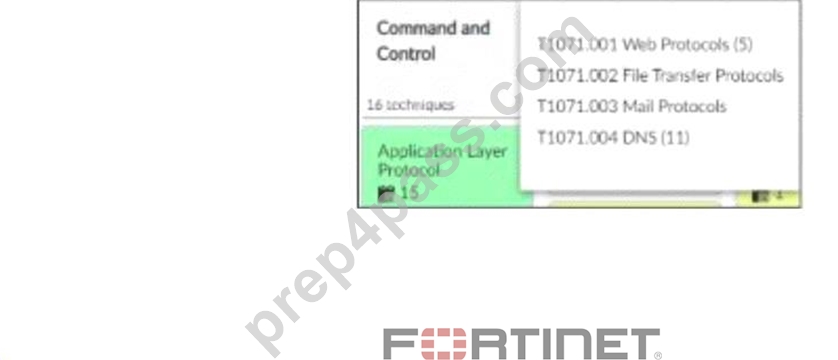
Which shows the partial output of the MITRE ATT&CK Enterprise matrix on FortiAnalyzer.
Which two statements are true? (Choose two.)
- A. There are 15 events associated with the tactic.
- B. There are four techniques that fall under tactic T1071.
- C. There are four subtechniques that fall under technique T1071.
- D. There are event handlers that cover tactic T1071.
Answer: C,D
Explanation:
* Understanding the MITRE ATT&CK Matrix:
* The MITRE ATT&CK framework is a knowledge base of adversary tactics and techniques based on real-world observations.
* Each tactic in the matrix represents the "why" of an attack technique, while each technique represents "how" an adversary achieves a tactic.
* Analyzing the Provided Exhibit:
* The exhibit shows part of the MITRE ATT&CK Enterprise matrix as displayed on FortiAnalyzer.
* The focus is on technique T1071 (Application Layer Protocol), which has subtechniques labeled T1071.001, T1071.002, T1071.003, and T1071.004.
* Each subtechnique specifies a different type of application layer protocol used for Command and Control (C2):
* T1071.001 Web Protocols
* T1071.002 File Transfer Protocols
* T1071.003 Mail Protocols
* T1071.004 DNS
* Identifying Key Points:
* Subtechniques under T1071:There are four subtechniques listed under the primary technique T1071, confirming that statement B is true.
* Event Handlers for T1071:FortiAnalyzer includes event handlers for monitoring various tactics and techniques. The presence of event handlers for tactic T1071 suggests active monitoring and alerting for these specific subtechniques, confirming that statement C is true.
* Misconceptions Clarified:
* Statement A (four techniques under tactic T1071) is incorrect because T1071 is a single technique with four subtechniques.
* Statement D (15 events associated with the tactic) is misleading. The number 15 refers to the techniques under the Application Layer Protocol, not directly related to the number of events.
Conclusion:
* The accurate interpretation of the exhibit confirms that there are four subtechniques under technique T1071 and that there are event handlers covering tactic T1071.
References:
MITRE ATT&CK Framework documentation.
FortiAnalyzer Event Handling and MITRE ATT&CK Integration guides.
NEW QUESTION # 33
Which three end user logs does FortiAnalyzer use to identify possible IOC compromised hosts? (Choose three answers)
- A. DNS filter logs2
- B. IPS logs
- C. Application filter logs
- D. Web filter logs1
- E. Email filter logs
Answer: A,B,D
Explanation:
Comprehensive and Detailed Explanation From FortiSOAR 7.6., FortiSIEM 7.3 Exact Extract study guide:
In the context of the Fortinet Security Fabric,FortiAnalyzerperforms Indicator of Compromise (IOC) detection by correlating various security logs against a threat intelligence database.3The IOC engine specifically analyzes the following logs of each end user to identify potentially compromised hosts:
* Web Filter Logs (A):The engine parses web filtering logs to identify access attempts to blacklisted URLs, malicious domains, or IPs associated with known malware distribution sites.4If a match is found in the threat database, the host is flagged as compromised.
* DNS Filter Logs (C):DNS requests are a primary indicator of a compromise. The engine monitors these logs for queries directed at known Command and Control (C2) servers or domains generated by Domain Generation Algorithms (DGA).5
* IPS Logs (E):Intrusion Prevention System (IPS) logs provide critical data on signature matches for known attacks. In newer Security Operations (SOC) curricula, IPS logs are used alongside Web and DNS logs to provide a high-fidelity assessment of whether a host is currently infected and attempting to communicate with an external threat actor.
Why other options are incorrect:
* Email Filter Logs (B):While important for detecting phishing attempts (Initial Access), email logs are generally used for content filtering and antispam rather than being a primary source for the IOC engine's behavioral "calling home" detection in the FortiAnalyzer Compromised Hosts view.
* Application Filter Logs (D):Application control logs provide visibility into software usage but are less commonly used by the core IOC engine for identifying blacklisted network destinations compared to Web and DNS filtering.
NEW QUESTION # 34
Refer to the exhibit.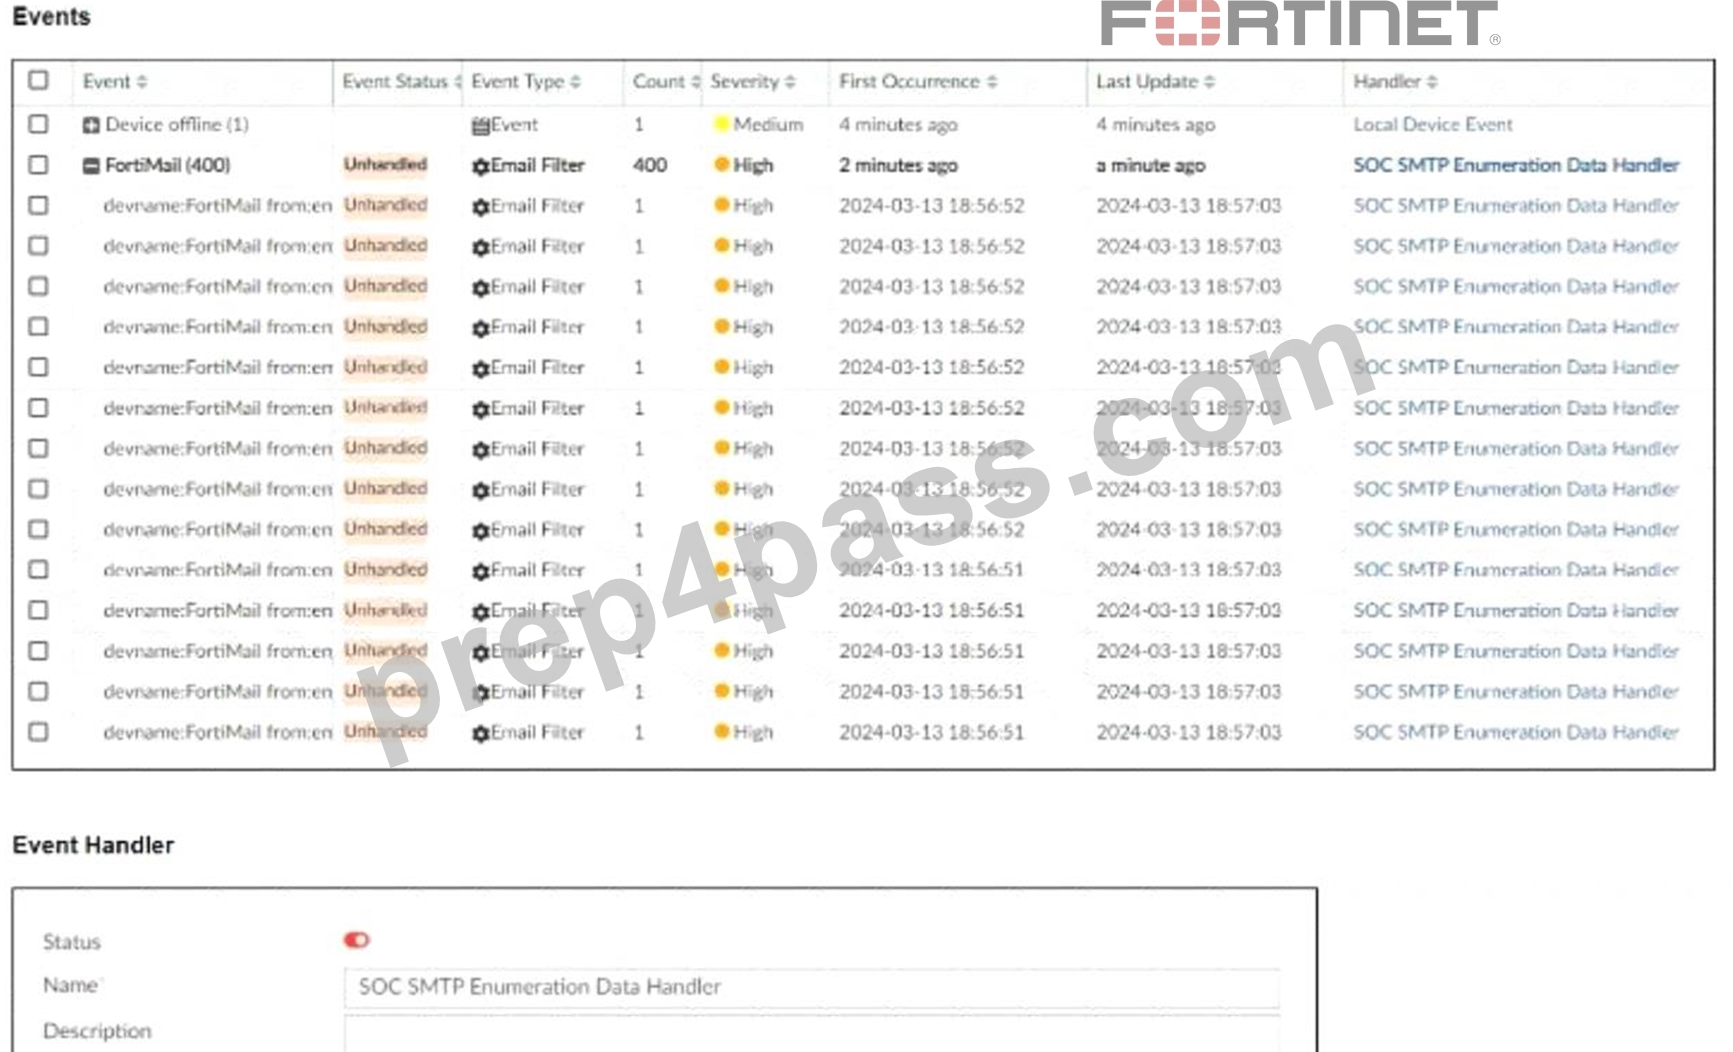
You notice that the custom event handler you configured to detect SMTP reconnaissance activities is creating a large number of events. This is overwhelming your notification system.
How can you fix this?
- A. Disable the custom event handler because it is not working as expected.
- B. Decrease the time range that the custom event handler covers during the attack.
- C. Increase the trigger count so that it identifies and reduces the count triggered by a particular group.
- D. Increase the log field value so that it looks for more unique field values when it creates the event.
Answer: C
Explanation:
* Understanding the Issue:
* The custom event handler for detecting SMTP reconnaissance activities is generating a large number of events.
* This high volume of events is overwhelming the notification system, leading to potential alert fatigue and inefficiency in incident response.
* Event Handler Configuration:
* Event handlers are configured to trigger alerts based on specific criteria.
* The frequency and volume of these alerts can be controlled by adjusting the trigger conditions.
* Possible Solutions:
* A. Increase the trigger count so that it identifies and reduces the count triggered by a particular group:
* By increasing the trigger count, you ensure that the event handler only generates alerts after a higher threshold of activity is detected.
* This reduces the number of events generated and helps prevent overwhelming the notification system.
* Selected as it effectively manages the volume of generated events.
* B. Disable the custom event handler because it is not working as expected:
* Disabling the event handler is not a practical solution as it would completely stop monitoring for SMTP reconnaissance activities.
* Not selected as it does not address the issue of fine-tuning the event generation.
* C. Decrease the time range that the custom event handler covers during the attack:
* Reducing the time range might help in some cases, but it could also lead to missing important activities if the attack spans a longer period.
* Not selected as it could lead to underreporting of significant events.
* D. Increase the log field value so that it looks for more unique field values when it creates the event:
* Adjusting the log field value might refine the event criteria, but it does not directly control the volume of alerts.
* Not selected as it is not the most effective way to manage event volume.
* Implementation Steps:
* Step 1: Access the event handler configuration in FortiAnalyzer.
* Step 2: Locate the trigger count setting within the custom event handler for SMTP reconnaissance.
* Step 3: Increase the trigger count to a higher value that balances alert sensitivity and volume.
* Step 4: Save the configuration and monitor the event generation to ensure it aligns with expected levels.
* Conclusion:
* By increasing the trigger count, you can effectively reduce the number of events generated by the custom event handler, preventing the notification system from being overwhelmed.
Fortinet Documentation on Event Handlers and Configuration FortiAnalyzer Administration Guide Best Practices for Event Management Fortinet Knowledge Base By increasing the trigger count in the custom event handler, you can manage the volume of generated events and prevent the notification system from being overwhelmed.
NEW QUESTION # 35
Which two ways can you create an incident on FortiAnalyzer? (Choose two.)
- A. Using a custom event handler
- B. Using a connector action
- C. Manually, on the Event Monitor page
- D. By running a playbook
Answer: A,C
Explanation:
* Understanding Incident Creation in FortiAnalyzer:
* FortiAnalyzer allows for the creation of incidents to track and manage security events.
* Incidents can be created both automatically and manually based on detected events and predefined rules.
* Analyzing the Methods:
* Option A:Using a connector action typically involves integrating with other systems or services and is not a direct method for creating incidents on FortiAnalyzer.
* Option B:Incidents can be created manually on the Event Monitor page by selecting relevant events and creating incidents from those events.
* Option C:While playbooks can automate responses and actions, the direct creation of incidents is usually managed through event handlers or manual processes.
* Option D:Custom event handlers can be configured to trigger incident creation based on specific events or conditions, automating the process within FortiAnalyzer.
* Conclusion:
* The two valid methods for creating an incident on FortiAnalyzer are manually on the Event Monitor page and using a custom event handler.
References:
Fortinet Documentation on Incident Management in FortiAnalyzer.
FortiAnalyzer Event Handling and Customization Guides.
NEW QUESTION # 36
Refer to the exhibits.
You configured a custom event handler and an associated rule to generate events whenever FortiMail detects spam emails. However, you notice that the event handler is generating events for both spam emails and clean emails.
Which change must you make in the rule so that it detects only spam emails?
- A. In the Trigger an event when field, select Within a group, the log field Spam Name (snane) has 2 or more unique values.
- B. In the Log filter by Text field, type type==spam.
- C. In the Log Type field, select Anti-Spam Log (spam)
- D. Disable the rule to use the filter in the data selector to create the event.
Answer: C
Explanation:
* Understanding the Custom Event Handler Configuration:
* The event handler is set up to generate events based on specific log data.
* The goal is to generate events specifically for spam emails detected by FortiMail.
* Analyzing the Issue:
* The event handler is currently generating events for both spam emails and clean emails.
* This indicates that the rule's filtering criteria are not correctly distinguishing between spam and non-spam emails.
* Evaluating the Options:
* Option A:Selecting the "Anti-Spam Log (spam)" in the Log Type field will ensure that only logs related to spam emails are considered. This is the most straightforward and accurate way to filter for spam emails.
* Option B:Typing type==spam in the Log filter by Text field might help filter the logs, but it is not as direct and reliable as selecting the correct log type.
* Option C:Disabling the rule to use the filter in the data selector to create the event does not address the issue of filtering for spam logs specifically.
* Option D:Selecting "Within a group, the log field Spam Name (snane) has 2 or more unique values" is not directly relevant to filtering spam logs and could lead to incorrect filtering criteria.
* Conclusion:
* The correct change to make in the rule is to select "Anti-Spam Log (spam)" in the Log Type field. This ensures that the event handler only generates events for spam emails.
References:
Fortinet Documentation on Event Handlers and Log Types.
Best Practices for Configuring FortiMail Anti-Spam Settings.
NEW QUESTION # 37
Refer to the exhibits.
What can you conclude from analyzing the data using the threat hunting module?
- A. Spearphishing is being used to elicit sensitive information.
- B. DNS tunneling is being used to extract confidential data from the local network.
- C. FTP is being used as command-and-control (C&C) technique to mine for data.
- D. Reconnaissance is being used to gather victim identity information from the mail server.
Answer: B
Explanation:
* Understanding the Threat Hunting Data:
* The Threat Hunting Monitor in the provided exhibits shows various application services, their usage counts, and data metrics such as sent bytes, average sent bytes, and maximum sent bytes.
* The second part of the exhibit lists connection attempts from a specific source IP (10.0.1.10) to a destination IP (8.8.8.8), with repeated "Connection Failed" messages.
* Analyzing the Application Services:
* DNS is the top application service with a significantly high count (251,400) and notable sent bytes (9.1 MB).
* This large volume of DNS traffic is unusual for regular DNS queries and can indicate the presence of DNS tunneling.
* DNS Tunneling:
* DNS tunneling is a technique used by attackers to bypass security controls by encoding data within DNS queries and responses. This allows them to extract data from the local network without detection.
* The high volume of DNS traffic, combined with the detailed metrics, suggests that DNS tunneling might be in use.
* Connection Failures to 8.8.8.8:
* The repeated connection attempts from the source IP (10.0.1.10) to the destination IP (8.8.8.8) with connection failures can indicate an attempt to communicate with an external server.
* Google DNS (8.8.8.8) is often used for DNS tunneling due to its reliability and global reach.
* Conclusion:
* Given the significant DNS traffic and the nature of the connection attempts, it is reasonable to conclude that DNS tunneling is being used to extract confidential data from the local network.
* Why Other Options are Less Likely:
* Spearphishing (A): There is no evidence from the provided data that points to spearphishing attempts, such as email logs or phishing indicators.
* Reconnaissance (C): The data does not indicate typical reconnaissance activities, such as scanning or probing mail servers.
* FTP C&C (D): There is no evidence of FTP traffic or command-and-control communications using FTP in the provided data.
SANS Institute: "DNS Tunneling: How to Detect Data Exfiltration and Tunneling Through DNS Queries" SANS DNS Tunneling OWASP: "DNS Tunneling" OWASP DNS Tunneling By analyzing the provided threat hunting data, it is evident that DNS tunneling is being used to exfiltrate data, indicating a sophisticated method of extracting confidential information from the network.
NEW QUESTION # 38
While monitoring your network, you discover that one FortiGate device is sending significantly more logs to FortiAnalyzer than all of the other FortiGate devices in the topology.
Additionally, the ADOM that the FortiGate devices are registered to consistently exceeds its quota.
What are two possible solutions? (Choose two.)
- A. Configure data selectors to filter the data sent by the first FortiGate device.
- B. Reconfigure the first FortiGate device to reduce the number of logs it forwards to FortiAnalyzer.
- C. Increase the storage space quota for the first FortiGate device.
- D. Create a separate ADOM for the first FortiGate device and configure a different set of storage policies.
Answer: B,D
Explanation:
* Understanding the Problem:
* One FortiGate device is generating a significantly higher volume of logs compared to other devices, causing the ADOM to exceed its storage quota.
* This can lead to performance issues and difficulties in managing logs effectively within FortiAnalyzer.
* Possible Solutions:
* The goal is to manage the volume of logs and ensure that the ADOM does not exceed its quota, while still maintaining effective log analysis and monitoring.
* Solution A: Increase the Storage Space Quota for the First FortiGate Device:
* While increasing the storage space quota might provide a temporary relief, it does not address the root cause of the issue, which is the excessive log volume.
* This solution might not be sustainable in the long term as log volume could continue to grow.
* Not selected as it does not provide a long-term, efficient solution.
* Solution B: Create a Separate ADOM for the First FortiGate Device and Configure a Different Set of Storage Policies:
* Creating a separate ADOM allows for tailored storage policies and management specifically for the high-log-volume device.
* This can help in distributing the storage load and applying more stringent or customized retention and storage policies.
* Selected as it effectively manages the storage and organization of logs.
* Solution C: Reconfigure the First FortiGate Device to Reduce the Number of Logs it Forwards to FortiAnalyzer:
* By adjusting the logging settings on the FortiGate device, you can reduce the volume of logs forwarded to FortiAnalyzer.
* This can include disabling unnecessary logging, reducing the logging level, or filtering out less critical logs.
* Selected as it directly addresses the issue of excessive log volume.
* Solution D: Configure Data Selectors to Filter the Data Sent by the First FortiGate Device:
* Data selectors can be used to filter the logs sent to FortiAnalyzer, ensuring only relevant logs are forwarded.
* This can help in reducing the volume of logs but might require detailed configuration and regular updates to ensure critical logs are not missed.
* Not selected as it might not be as effective as reconfiguring logging settings directly on the FortiGate device.
* Implementation Steps:
* For Solution B:
* Step 1: Access FortiAnalyzer and navigate to the ADOM management section.
* Step 2: Create a new ADOM for the high-log-volume FortiGate device.
* Step 3: Register the FortiGate device to this new ADOM.
* Step 4: Configure specific storage policies for the new ADOM to manage log retention and storage.
* For Solution C:
* Step 1: Access the FortiGate device's configuration interface.
* Step 2: Navigate to the logging settings.
* Step 3: Adjust the logging level and disable unnecessary logs.
* Step 4: Save the configuration and monitor the log volume sent to FortiAnalyzer.
Fortinet Documentation on FortiAnalyzer ADOMs and log management FortiAnalyzer Administration Guide Fortinet Knowledge Base on configuring log settings on FortiGate FortiGate Logging Guide By creating a separate ADOM for the high-log-volume FortiGate device and reconfiguring its logging settings, you can effectively manage the log volume and ensure the ADOM does not exceed its quota.
NEW QUESTION # 39
Refer to the exhibit.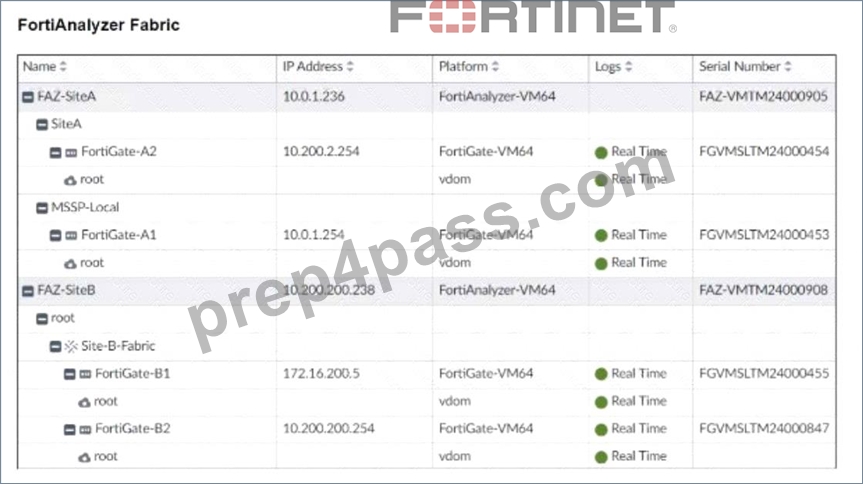
Assume that all devices in the FortiAnalyzer Fabric are shown in the image.
Which two statements about the FortiAnalyzer Fabric deployment are true? (Choose two.)
- A. FAZ-SiteA has two ADOMs enabled.
- B. FortiGate-B1 and FortiGate-B2 are in a Security Fabric.
- C. There is no collector in the topology.
- D. All FortiGate devices are directly registered to the supervisor.
Answer: A,B
Explanation:
* Understanding the FortiAnalyzer Fabric:
* The FortiAnalyzer Fabric provides centralized log collection, analysis, and reporting for connected FortiGate devices.
* Devices in a FortiAnalyzer Fabric can be organized into different Administrative Domains (ADOMs) to separate logs and management.
* Analyzing the Exhibit:
* FAZ-SiteAandFAZ-SiteBare FortiAnalyzer devices in the fabric.
* FortiGate-B1andFortiGate-B2are shown under theSite-B-Fabric, indicating they are part of the same Security Fabric.
* FAZ-SiteAhas multiple entries under it:SiteAandMSSP-Local, suggesting multiple ADOMs are enabled.
* Evaluating the Options:
* Option A:FortiGate-B1 and FortiGate-B2 are underSite-B-Fabric, indicating they are indeed part of the same Security Fabric.
* Option B:The presence of FAZ-SiteA and FAZ-SiteB as FortiAnalyzers does not preclude the existence of collectors. However, there is no explicit mention of a separate collector role in the exhibit.
* Option C:Not all FortiGate devices are directly registered to the supervisor. The exhibit shows hierarchical organization under different sites and ADOMs.
* Option D:The multiple entries underFAZ-SiteA(SiteA and MSSP-Local) indicate that FAZ-SiteA has two ADOMs enabled.
* Conclusion:
* FortiGate-B1 and FortiGate-B2 are in a Security Fabric.
* FAZ-SiteA has two ADOMs enabled.
References:
Fortinet Documentation on FortiAnalyzer Fabric Topology and ADOM Configuration.
Best Practices for Security Fabric Deployment with FortiAnalyzer.
NEW QUESTION # 40
......
Pass Your NSE7_SOC_AR-7.6 Exam Easily With 100% Exam Passing Guarantee: https://questionsfree.prep4pass.com/NSE7_SOC_AR-7.6_exam-braindumps.html
